Cities with the most expensive homes in Maine
Purchasing a home is one of the most important investments there is. More than a place to live, homeownership is an asset with the potential to tremendously rise in value. But with home prices reaching record heights, plays a huge role for buyers.
The typical home value in the United States was $366,712 in April, 0.7% higher than the year before.
High mortgage rates are also making monthly payments more expensive; as of May 14, the sits at 6.36%.
Although home prices have inflated all across the U.S., there are some cities that command a higher price tag than others. Location, size, age, and condition are all contributing factors to home value.
compiled a list of cities with the most expensive homes in Maine using data from . Cities are ranked by the Zillow Home Values Index for all homes as of April 2026. The charts in this story were created automatically using .
All 30 cities on the list are in the Portland-South Portland, ME metro area.
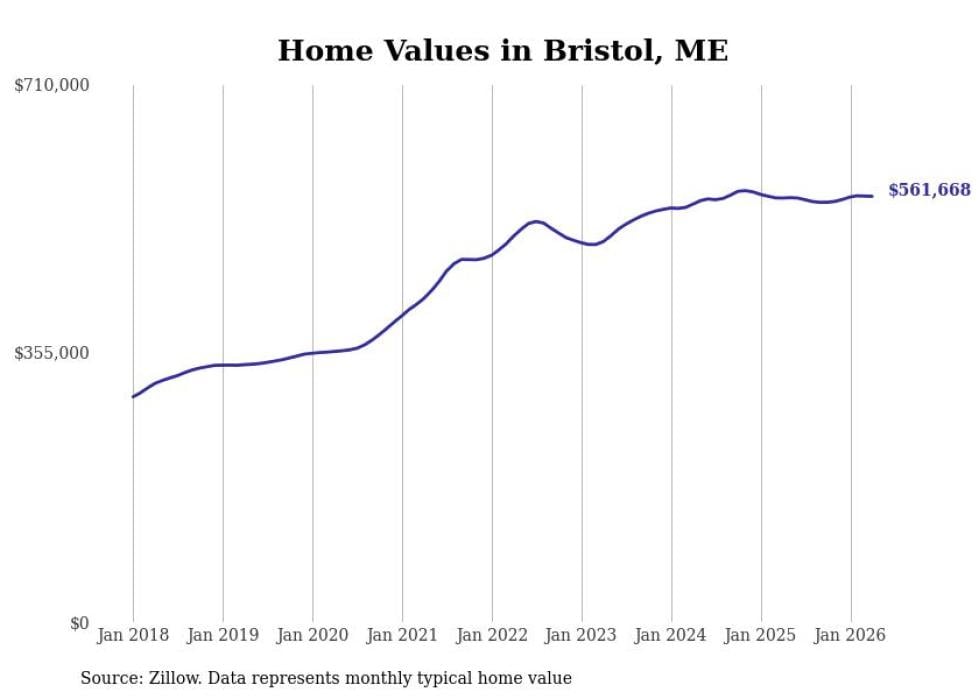
#30. Bristol
- Typical home value: $561,668
- 1-year price change: +0.4%
- 5-year price change: +31.5%
- Metro area: not in a metro area
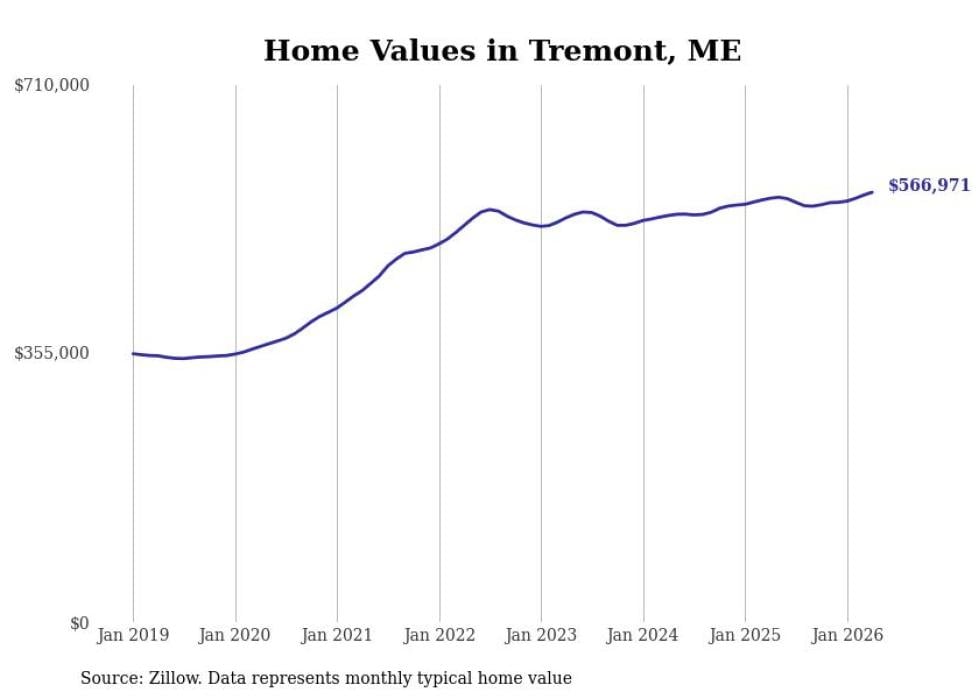
#29. Tremont
- Typical home value: $566,971
- 1-year price change: +1.4%
- 5-year price change: +29.7%
- Metro area: not in a metro area
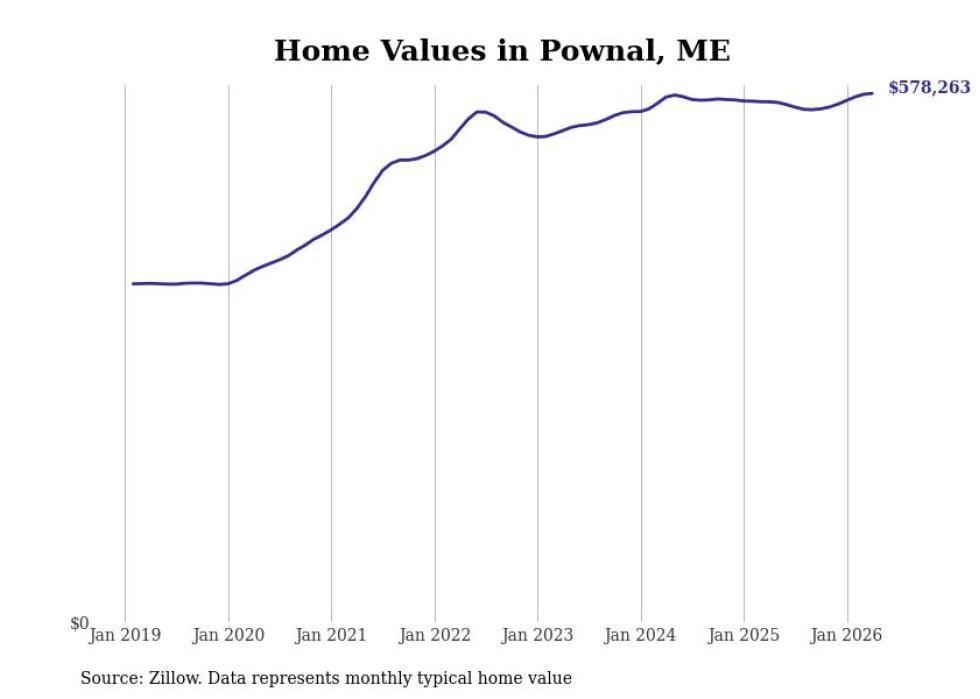
#28. Pownal
- Typical home value: $578,263
- 1-year price change: +1.6%
- 5-year price change: +27.9%
- Metro area: Portland-South Portland, ME
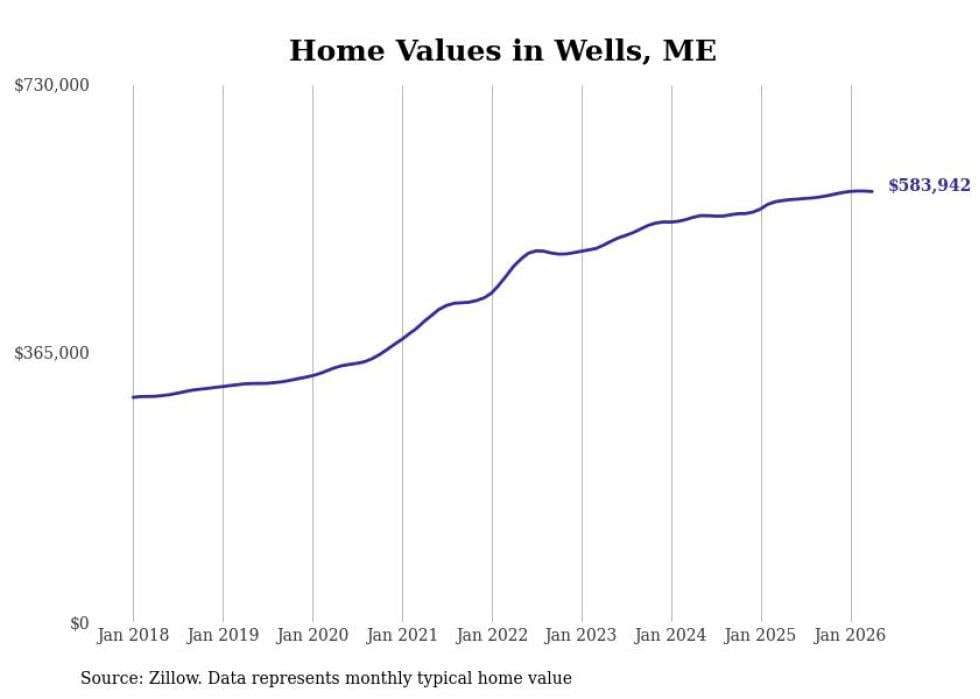
#27. Wells
- Typical home value: $583,942
- 1-year price change: +2.1%
- 5-year price change: +43.3%
- Metro area: Portland-South Portland, ME
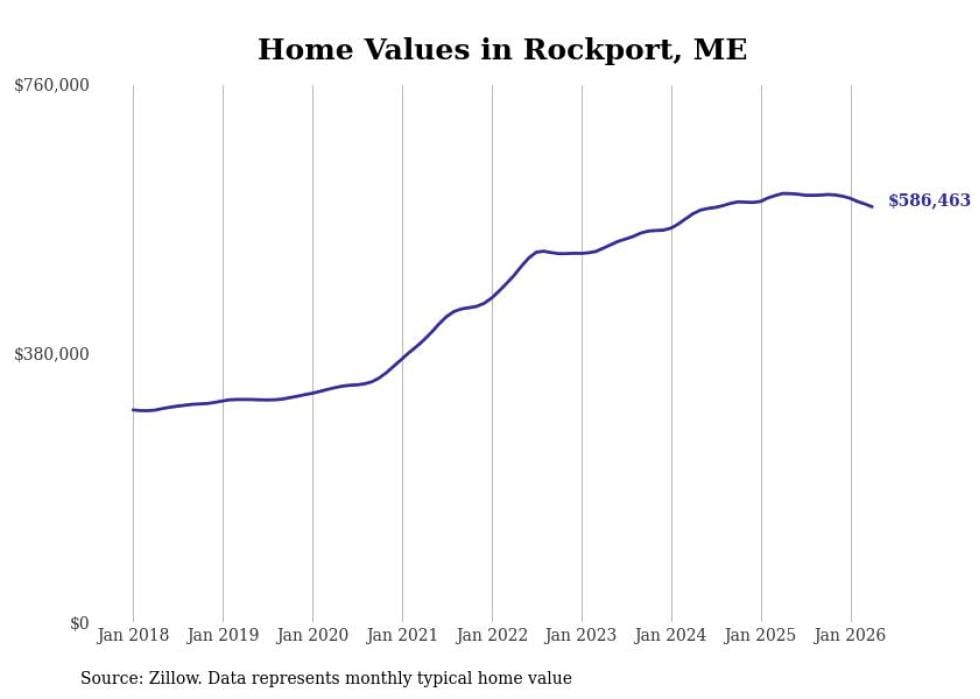
#26. Rockport
- Typical home value: $586,463
- 1-year price change: -3.1%
- 5-year price change: +47.2%
- Metro area: not in a metro area
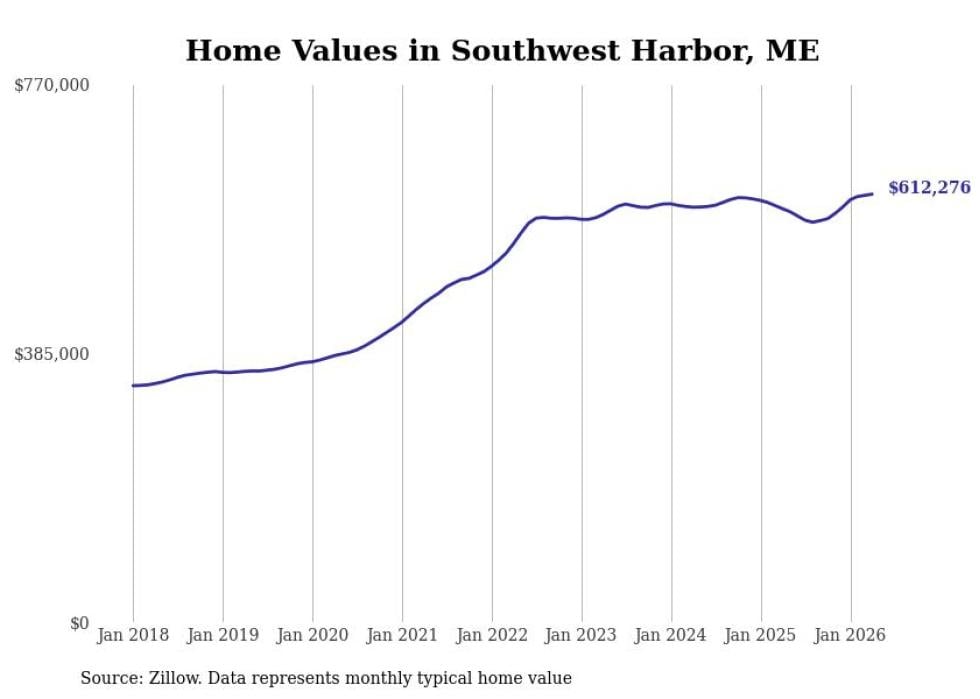
#25. Southwest Harbor
- Typical home value: $612,276
- 1-year price change: +3.5%
- 5-year price change: +34.2%
- Metro area: not in a metro area
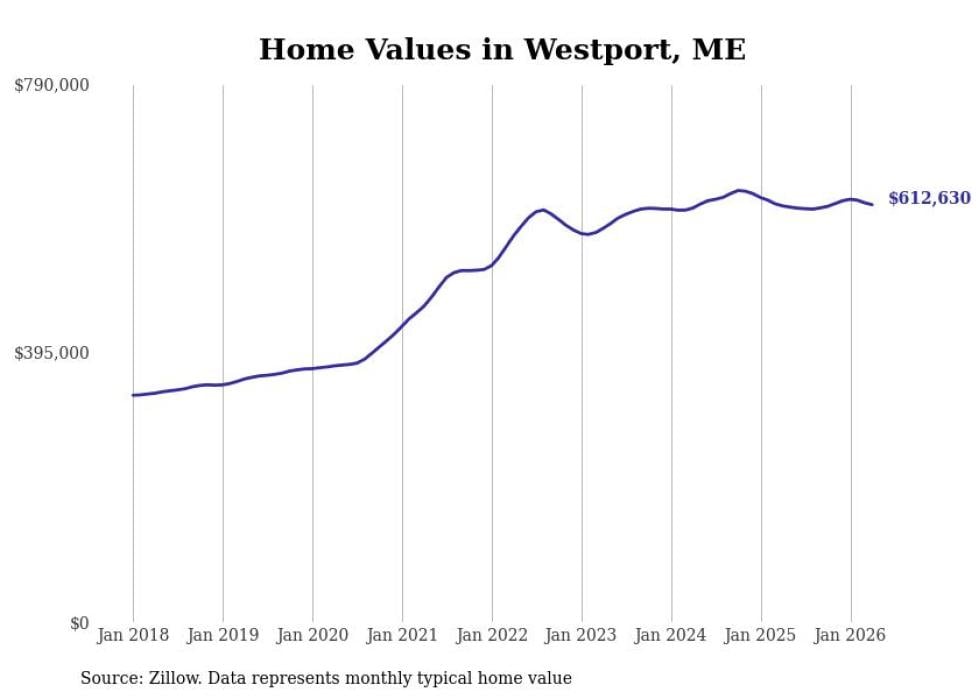
#24. Westport
- Typical home value: $612,630
- 1-year price change: +0.3%
- 5-year price change: +32.1%
- Metro area: not in a metro area
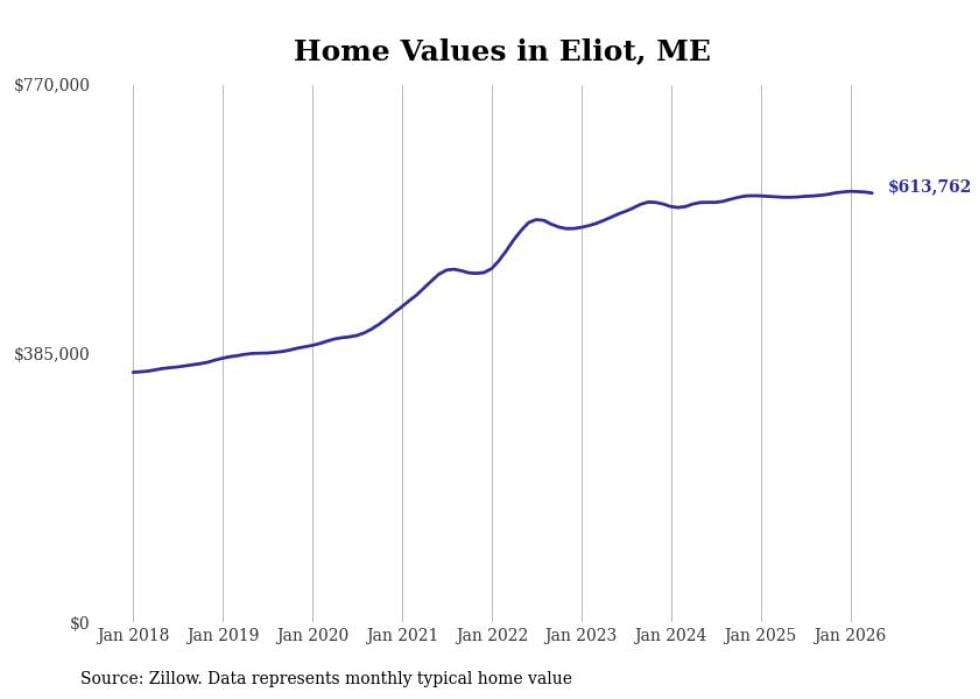
#23. Eliot
- Typical home value: $613,762
- 1-year price change: +1.0%
- 5-year price change: +28.4%
- Metro area: Portland-South Portland, ME
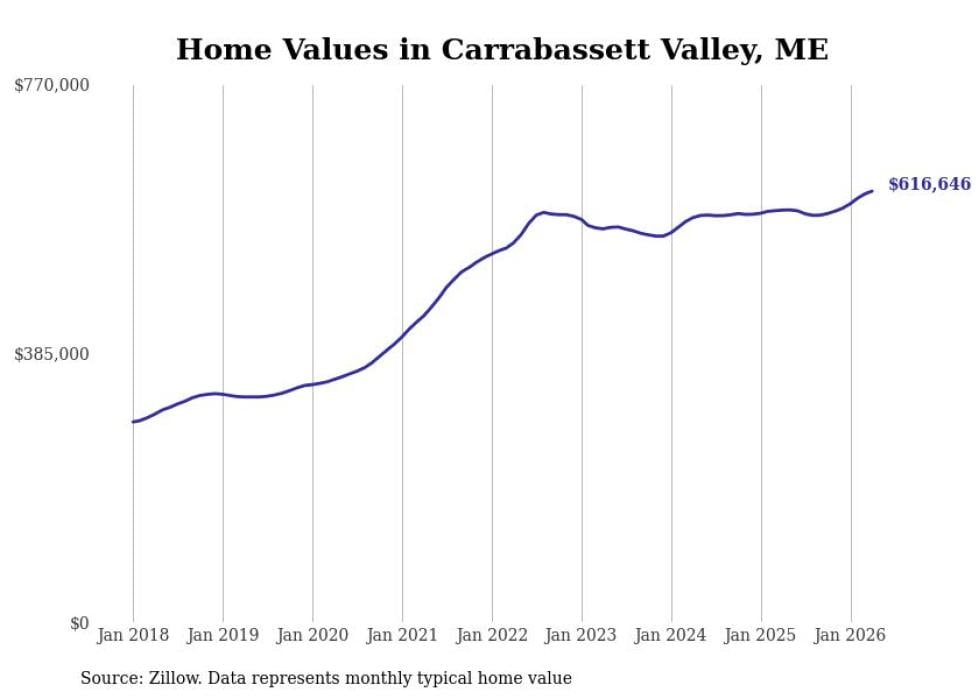
#22. Carrabassett Valley
- Typical home value: $616,646
- 1-year price change: +4.6%
- 5-year price change: +40.7%
- Metro area: not in a metro area
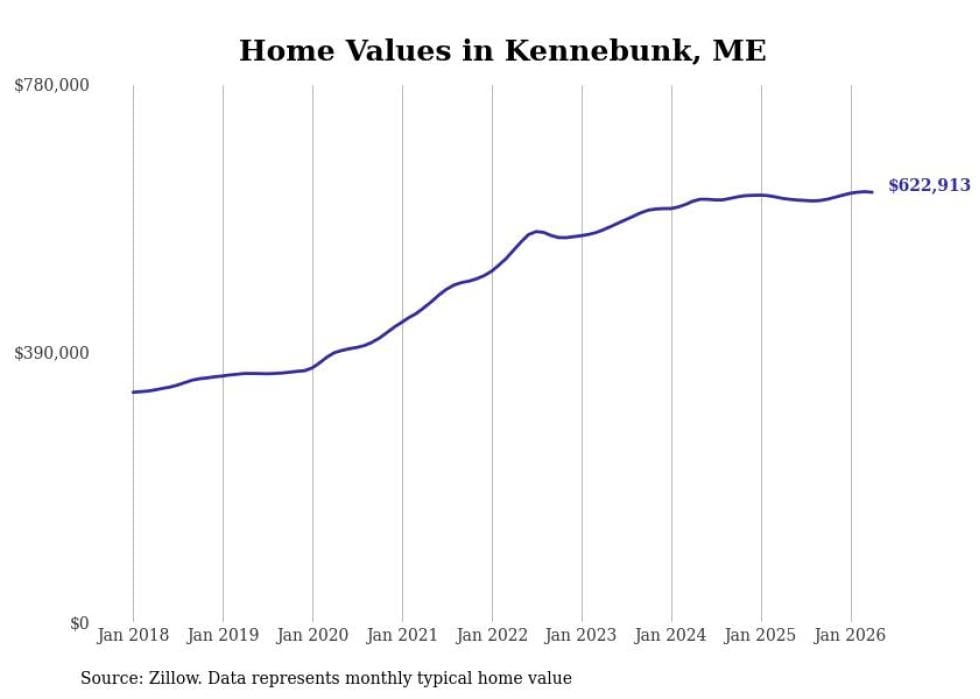
#21. Kennebunk
- Typical home value: $622,913
- 1-year price change: +1.4%
- 5-year price change: +36.7%
- Metro area: Portland-South Portland, ME
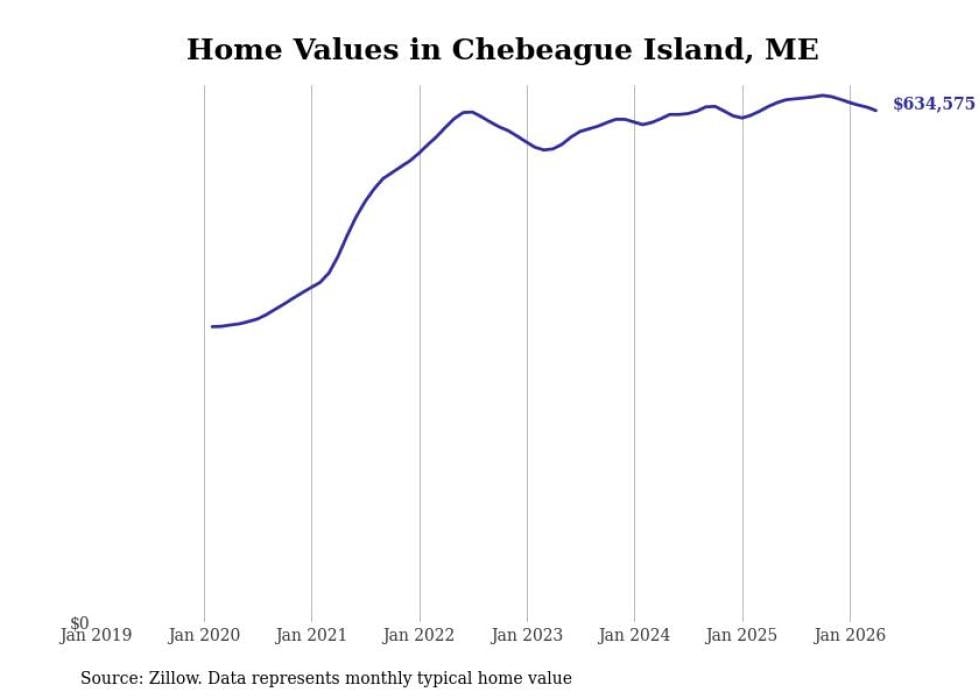
#20. Chebeague Island
- Typical home value: $634,575
- 1-year price change: -0.8%
- 5-year price change: +40.0%
- Metro area: Portland-South Portland, ME
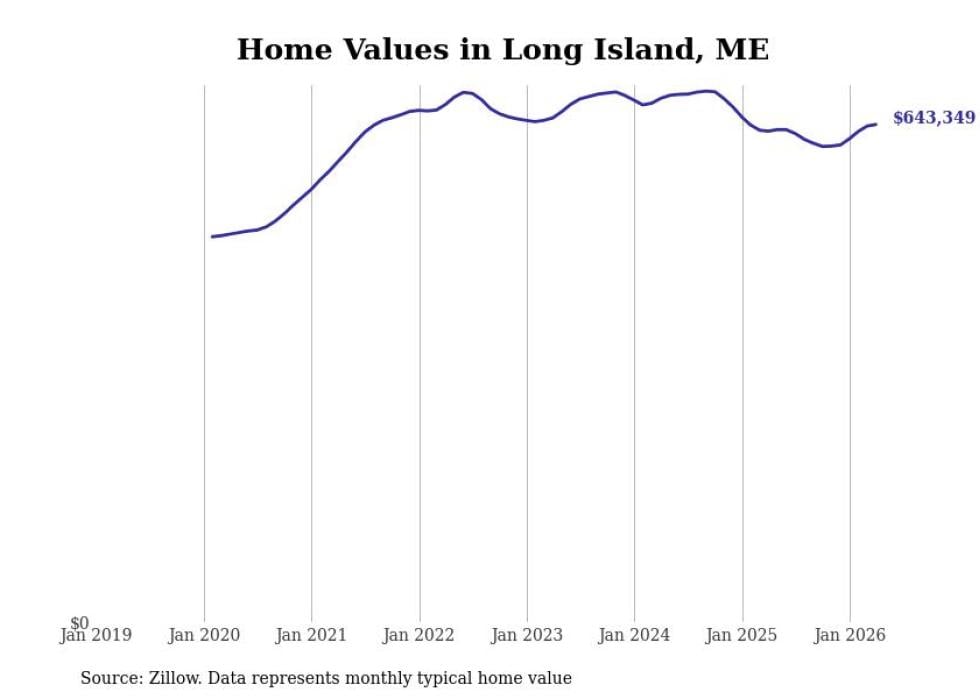
#19. Long Island
- Typical home value: $643,349
- 1-year price change: +1.4%
- 5-year price change: +8.1%
- Metro area: Portland-South Portland, ME
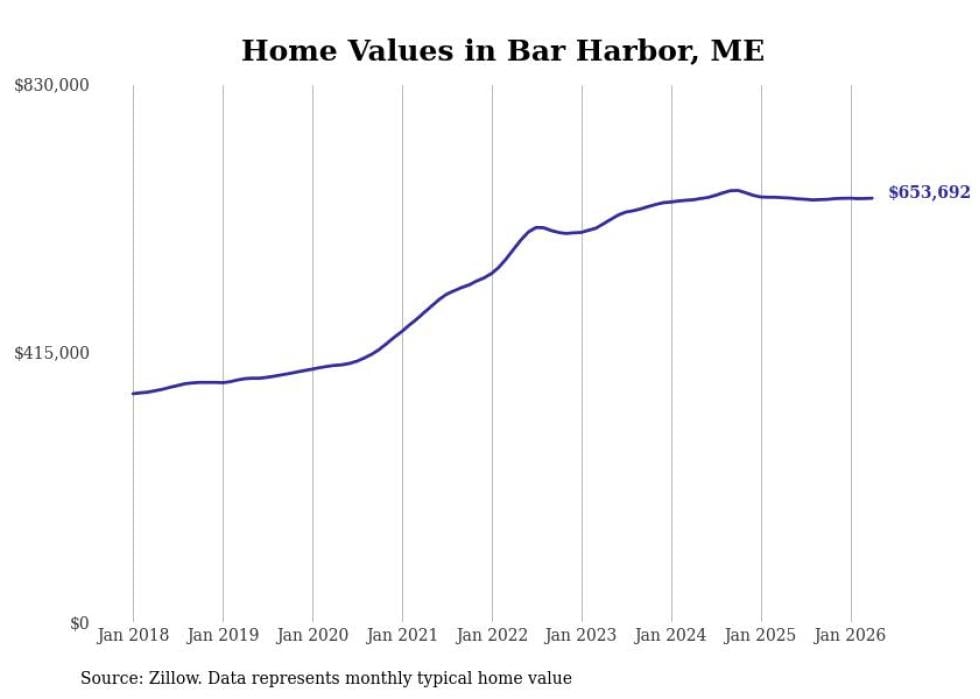
#18. Bar Harbor
- Typical home value: $653,692
- 1-year price change: -0.1%
- 5-year price change: +37.0%
- Metro area: not in a metro area
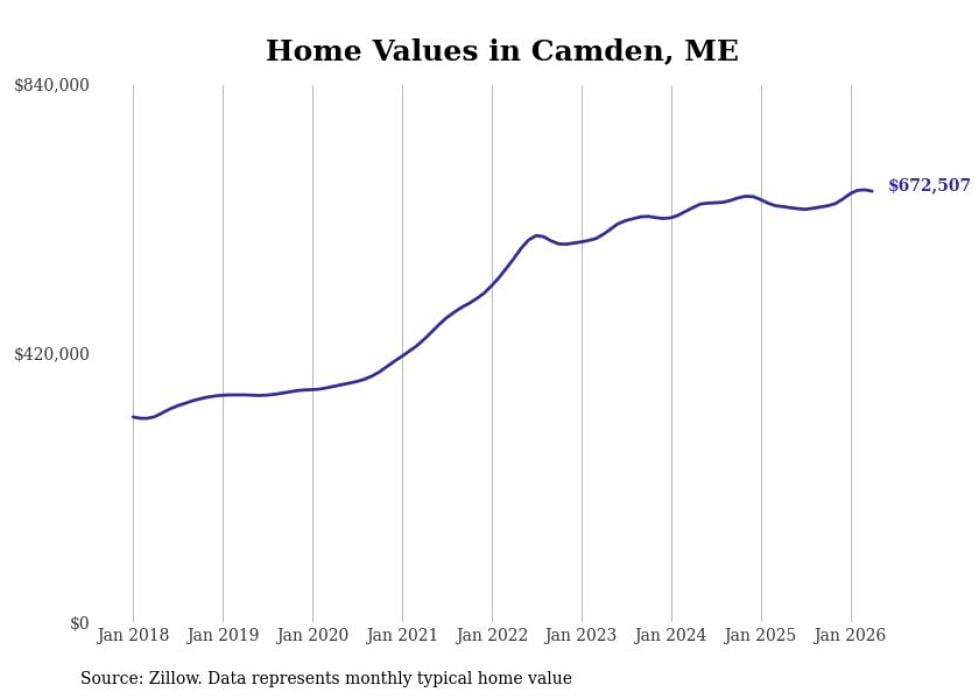
#17. Camden
- Typical home value: $672,507
- 1-year price change: +3.7%
- 5-year price change: +52.5%
- Metro area: not in a metro area
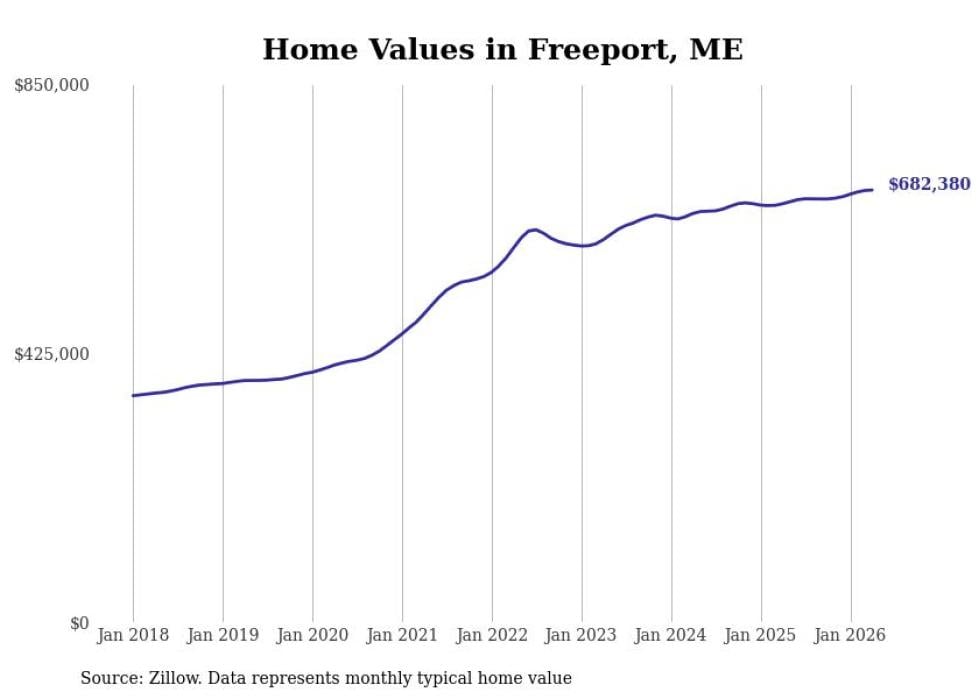
#16. Freeport
- Typical home value: $682,380
- 1-year price change: +3.3%
- 5-year price change: +40.2%
- Metro area: Portland-South Portland, ME
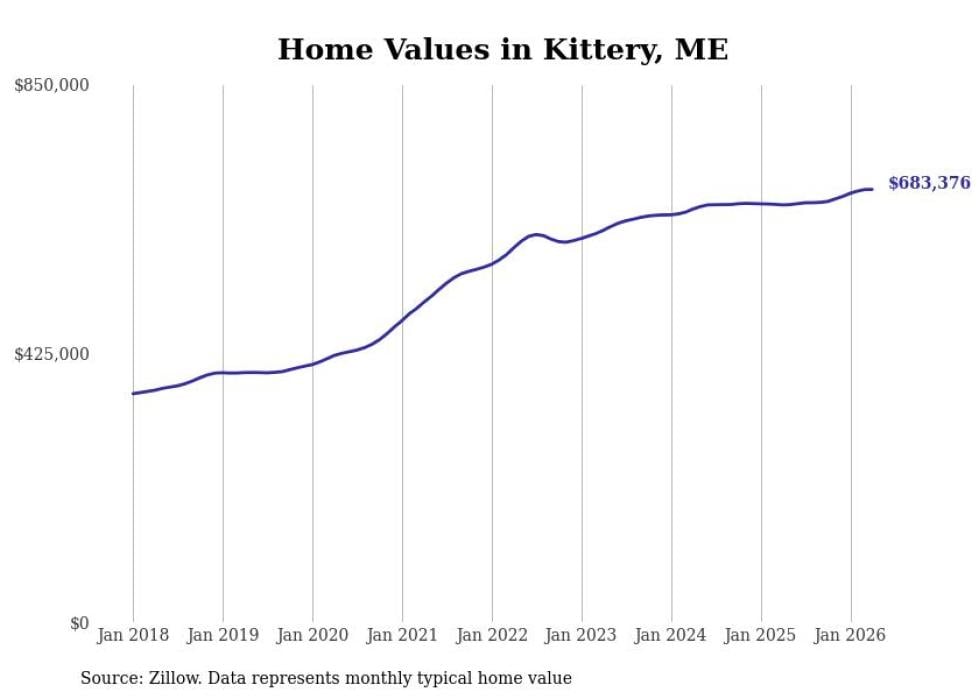
#15. Kittery
- Typical home value: $683,376
- 1-year price change: +3.7%
- 5-year price change: +35.3%
- Metro area: Portland-South Portland, ME
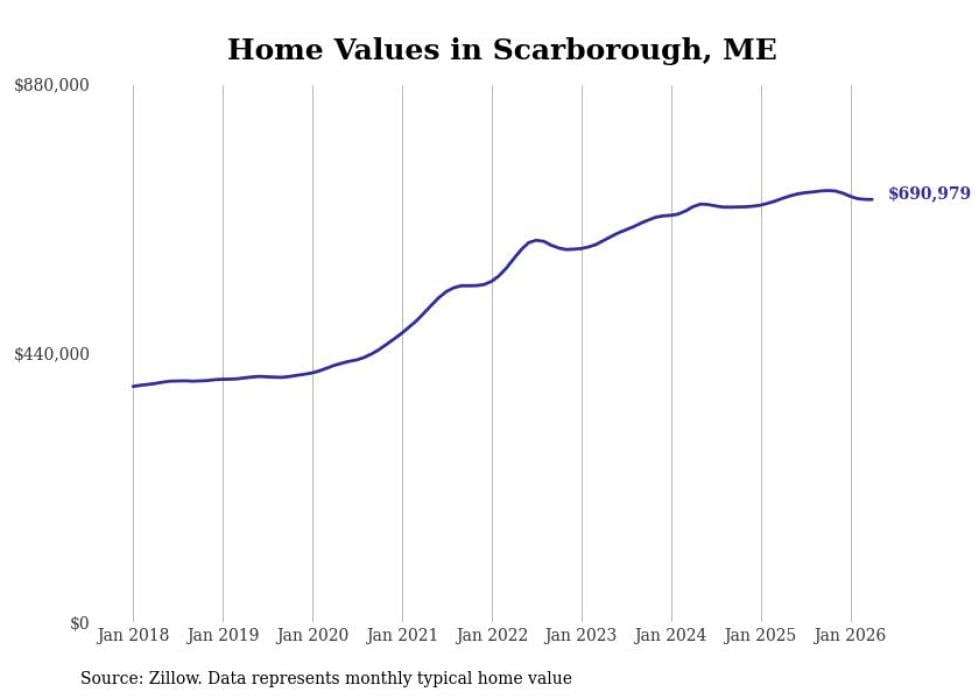
#14. Scarborough
- Typical home value: $690,979
- 1-year price change: -0.3%
- 5-year price change: +36.8%
- Metro area: Portland-South Portland, ME
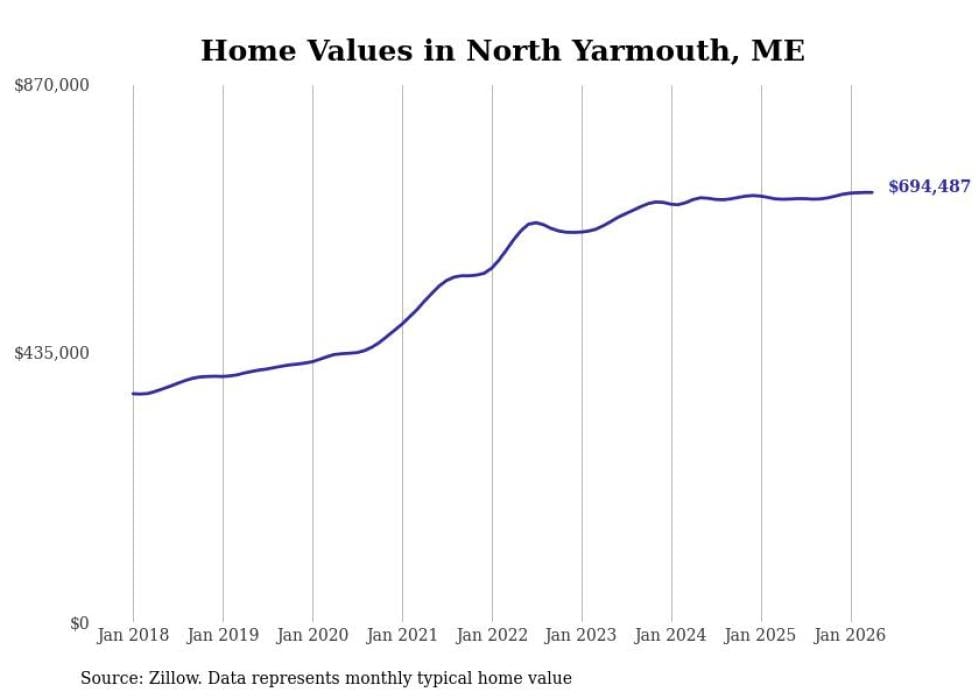
#13. North Yarmouth
- Typical home value: $694,487
- 1-year price change: +1.6%
- 5-year price change: +34.1%
- Metro area: Portland-South Portland, ME
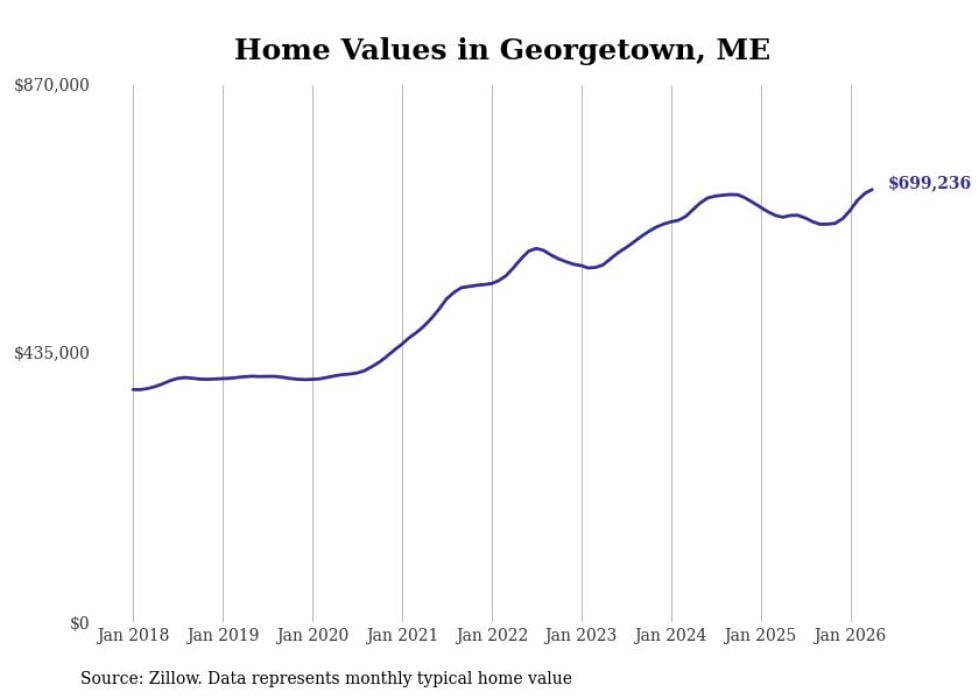
#12. Georgetown
- Typical home value: $699,236
- 1-year price change: +6.8%
- 5-year price change: +46.2%
- Metro area: Portland-South Portland, ME
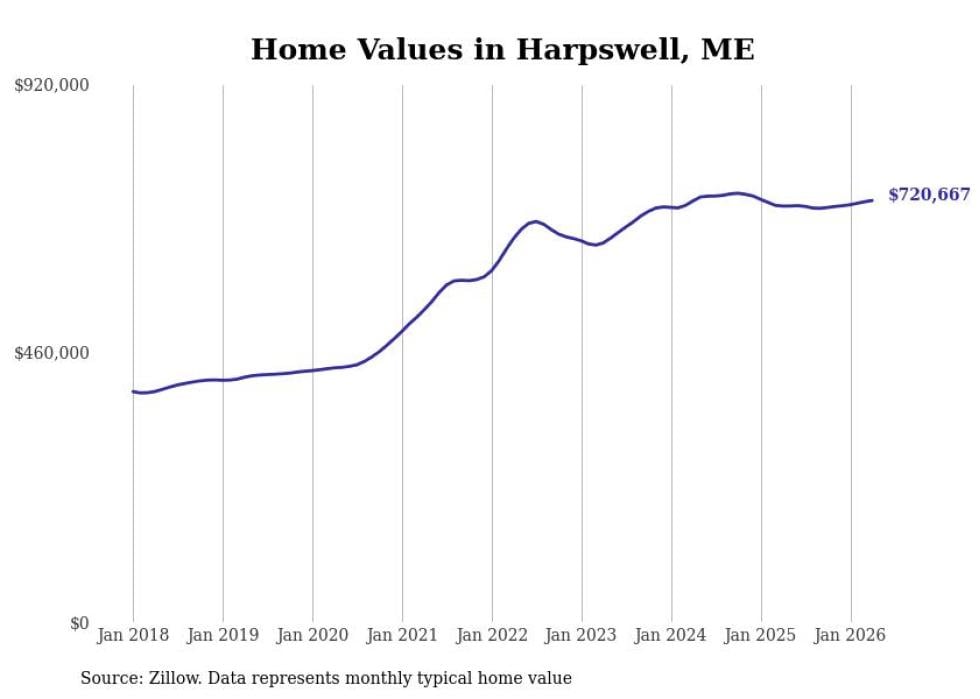
#11. Harpswell
- Typical home value: $720,667
- 1-year price change: +1.3%
- 5-year price change: +35.1%
- Metro area: Portland-South Portland, ME
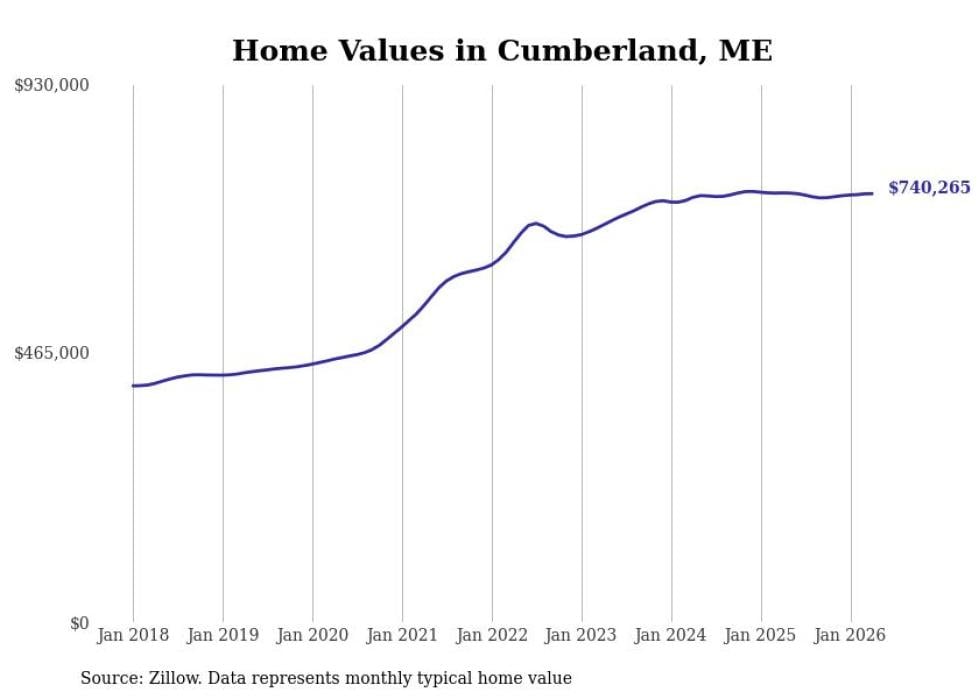
#10. Cumberland
- Typical home value: $740,265
- 1-year price change: -0.2%
- 5-year price change: +35.3%
- Metro area: Portland-South Portland, ME
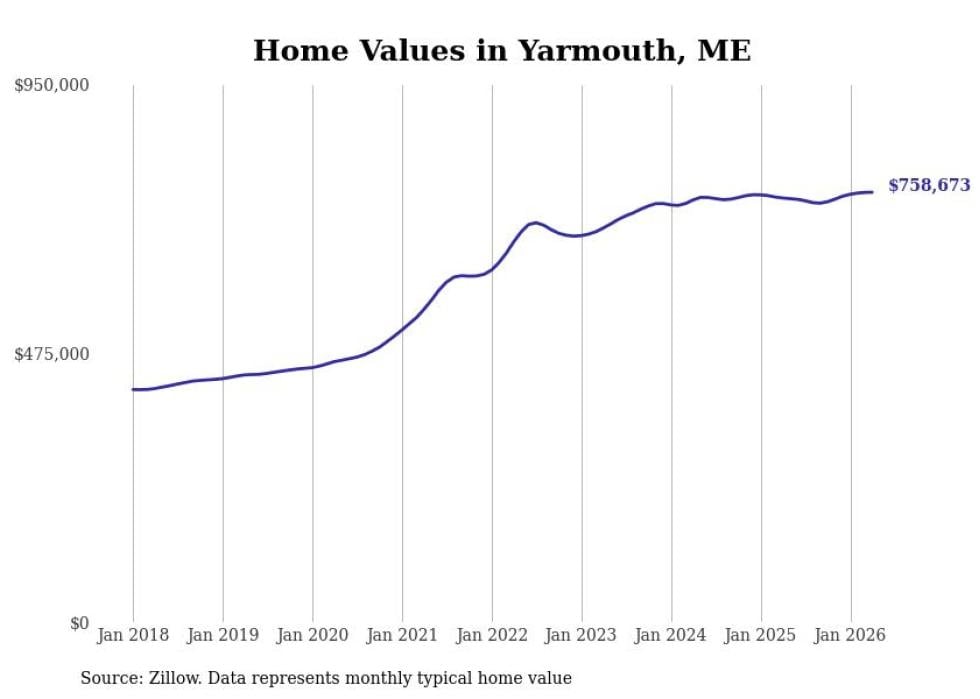
#9. Yarmouth
- Typical home value: $758,673
- 1-year price change: +1.3%
- 5-year price change: +37.4%
- Metro area: Portland-South Portland, ME
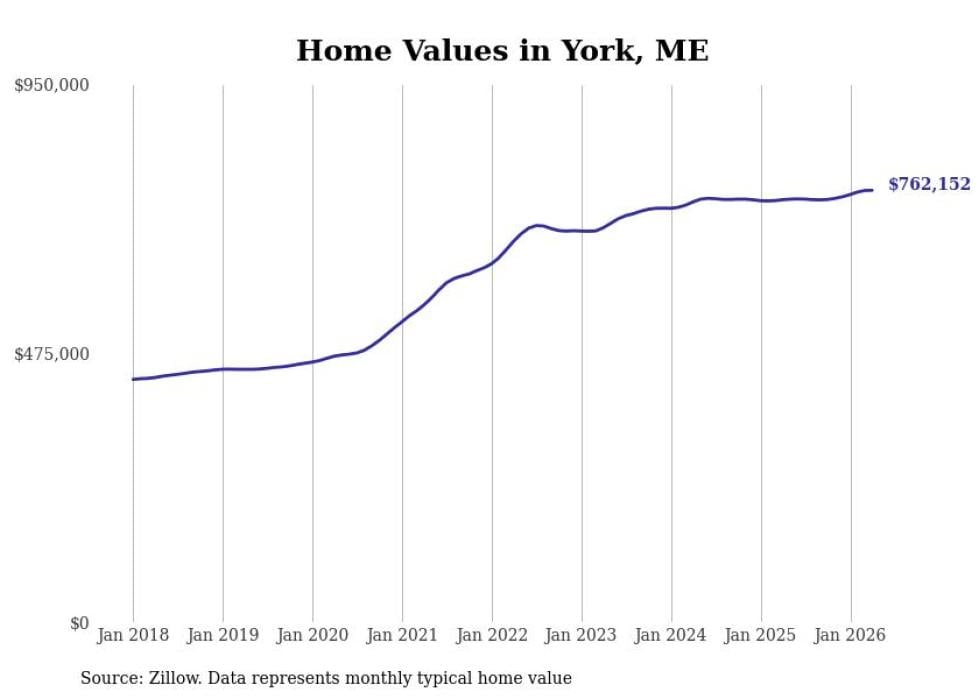
#8. York
- Typical home value: $762,152
- 1-year price change: +2.2%
- 5-year price change: +36.2%
- Metro area: Portland-South Portland, ME
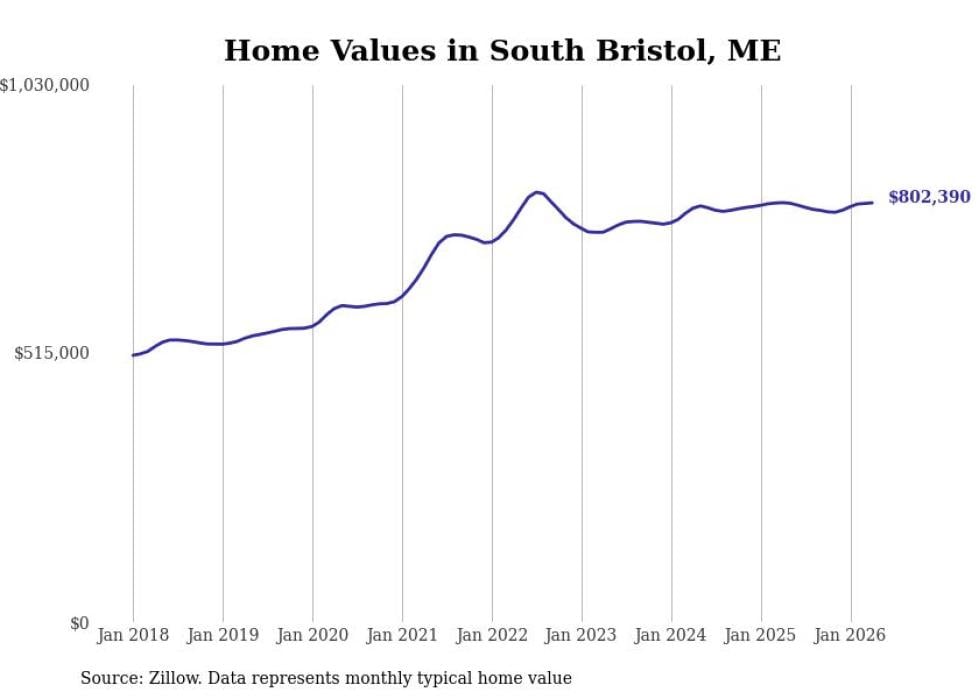
#7. South Bristol
- Typical home value: $802,390
- 1-year price change: -0.0%
- 5-year price change: +18.4%
- Metro area: not in a metro area
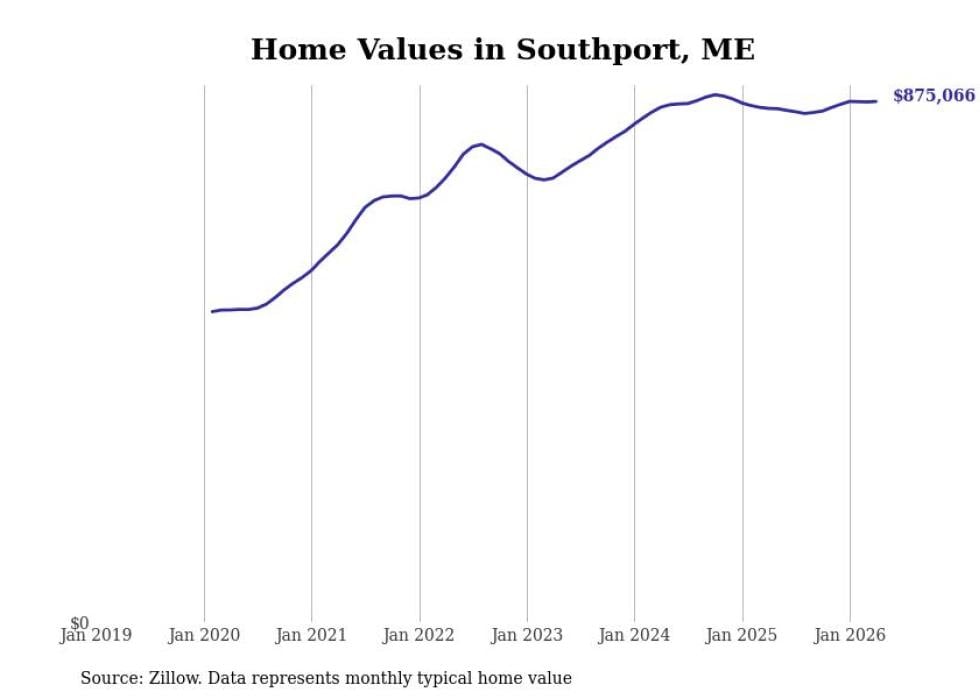
#6. Southport
- Typical home value: $875,066
- 1-year price change: +1.4%
- 5-year price change: +37.9%
- Metro area: not in a metro area
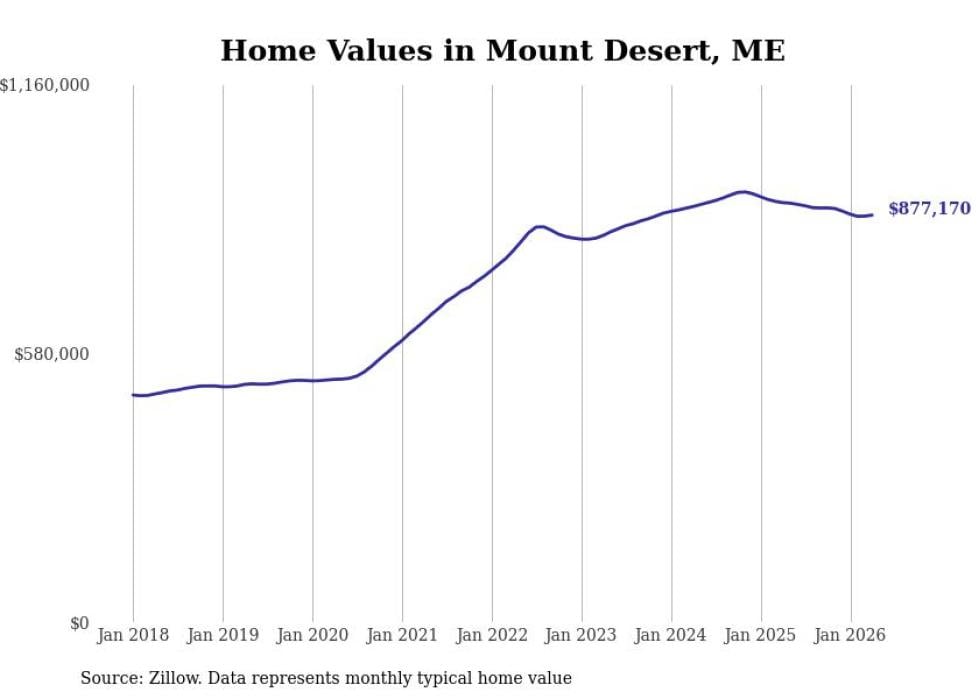
#5. Mount Desert
- Typical home value: $877,170
- 1-year price change: -3.0%
- 5-year price change: +35.3%
- Metro area: not in a metro area
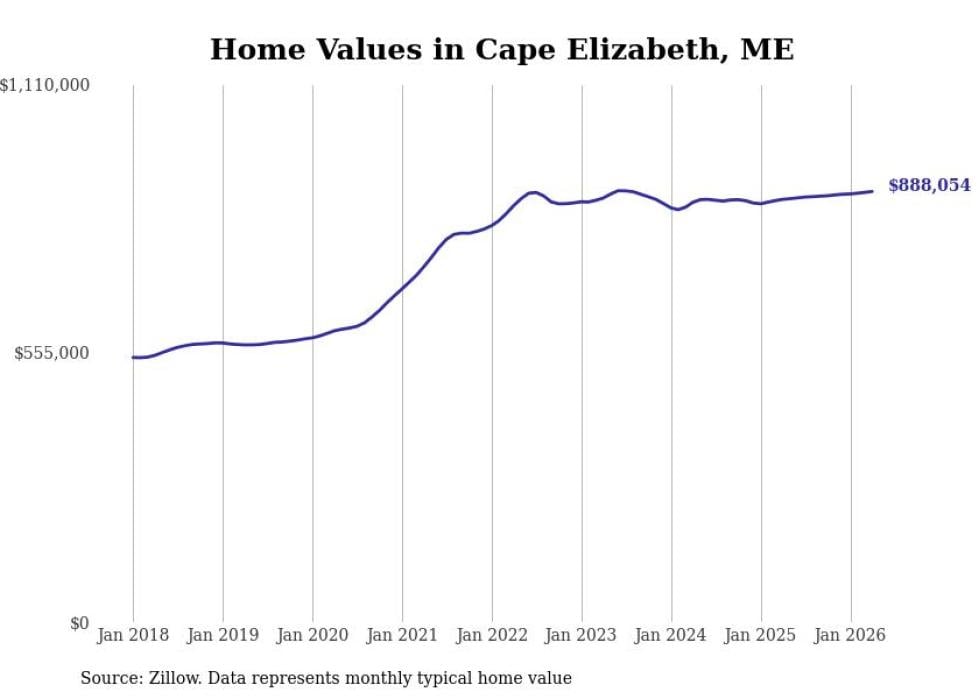
#4. Cape Elizabeth
- Typical home value: $888,054
- 1-year price change: +1.9%
- 5-year price change: +21.1%
- Metro area: Portland-South Portland, ME
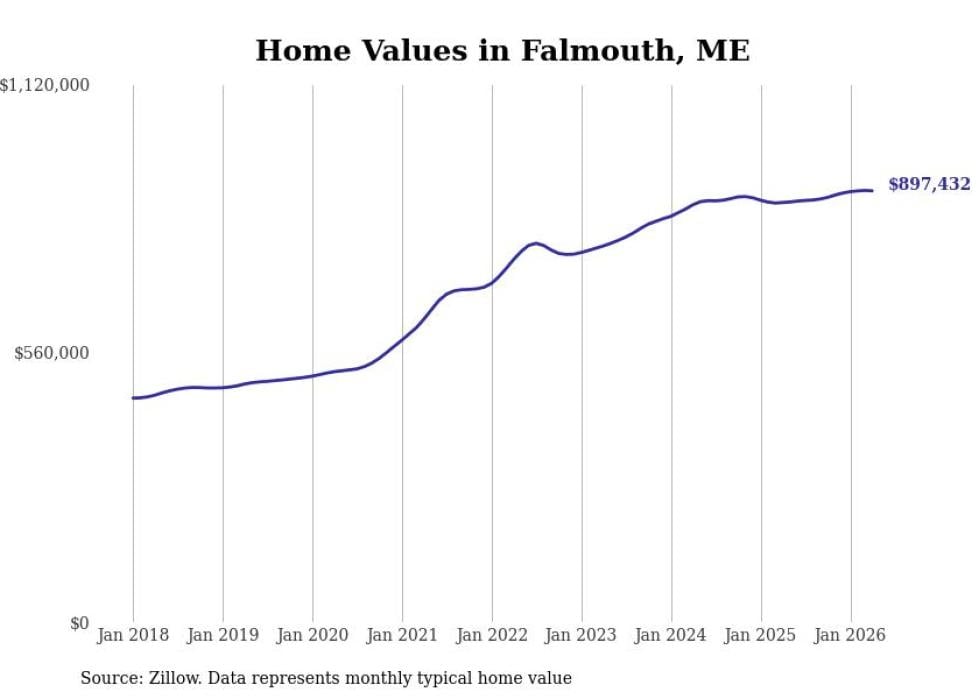
#3. Falmouth
- Typical home value: $897,432
- 1-year price change: +2.8%
- 5-year price change: +42.3%
- Metro area: Portland-South Portland, ME
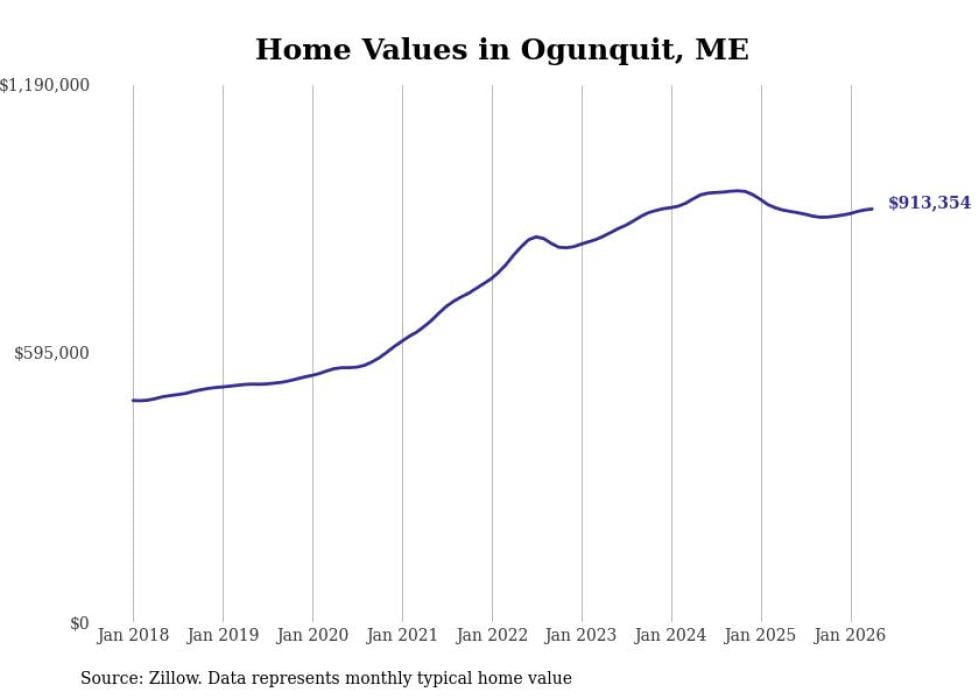
#2. Ogunquit
- Typical home value: $913,354
- 1-year price change: +0.2%
- 5-year price change: +39.8%
- Metro area: Portland-South Portland, ME
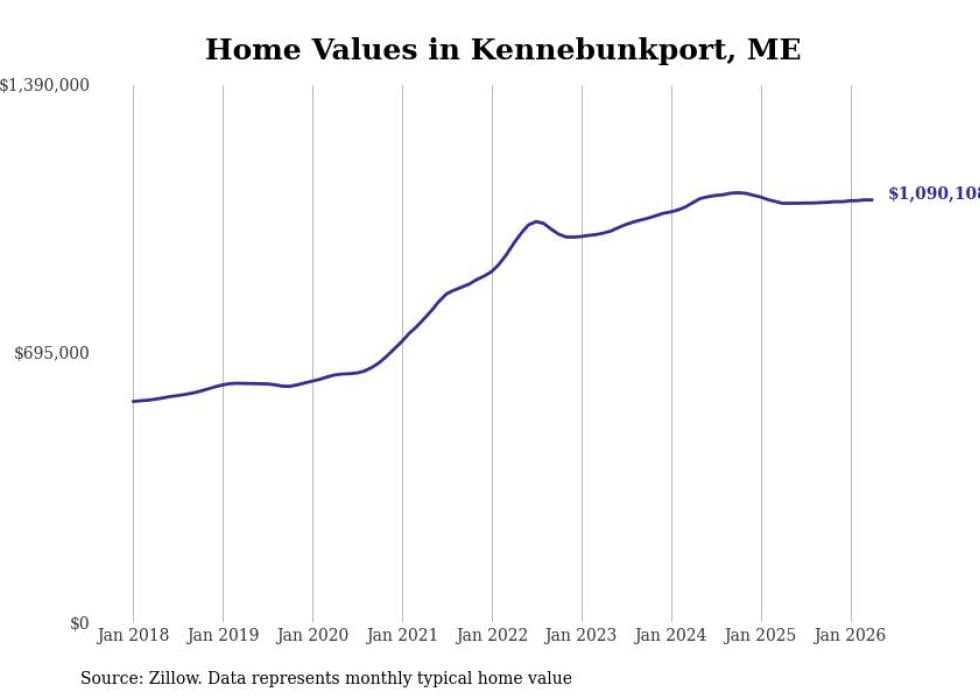
#1. Kennebunkport
- Typical home value: $1,090,108
- 1-year price change: +0.8%
- 5-year price change: +39.2%
- Metro area: Portland-South Portland, ME