
First-time homebuyers are holding their ground against investors
For years, headlines have painted investors as the unbeatable force in America’s housing market, but that might not tell the full story. from suggests that first-time homebuyers continue to play a major role in the nation’s starter-home market, capturing an average of 69% of starter-home purchases across 30 U.S. metros.
The analysis found that investor dominance is concentrated in markets with fewer limits on short-term rentals or investor ownership. In contrast, metros with stronger affordability protections and owner-occupant policies show a clear advantage for first-time homebuyers.
Study Highlights
- First-time homebuyers purchase the majority of starter homes. Across the 30 metros analyzed, first-time homebuyers accounted for an average of 69% of purchases, while investors represented 31%.
- Investor dominance is localized. Of the cities evaluated, only a handful showed investor dominance in the market. Miami had the highest number of investor starter home purchases at 57%.
- Local laws play a large role. State and municipal-level protections, such as California’s SB 1079, give owner-occupants a window to compete before investors. Meanwhile, short-term rental regulations in cities such as Seattle, Denver, and Los Angeles continue to reinforce first-time homebuyer presence in entry-level markets by limiting investor profit potential.
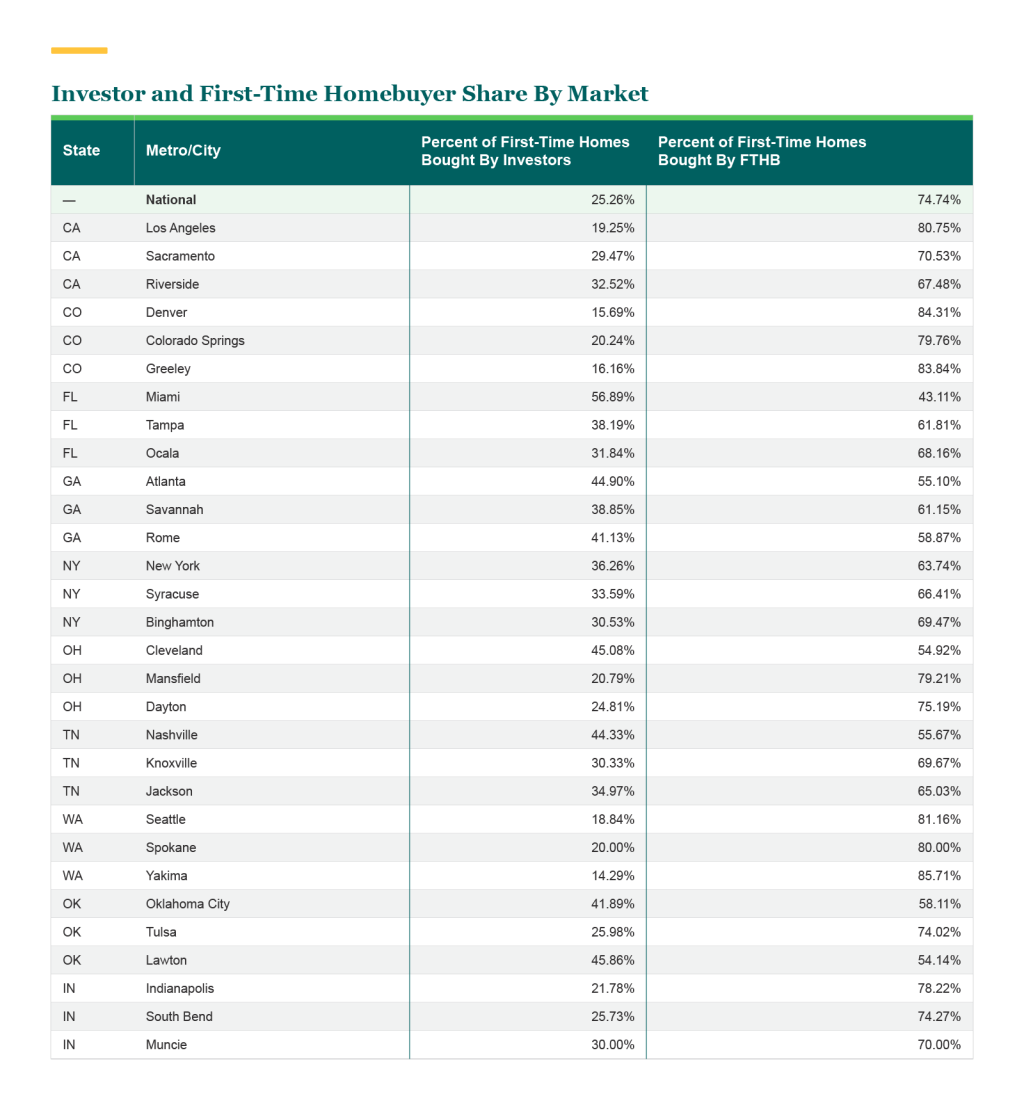
FTHB vs. Investor Starter Home Share Across 30 U.S. Cities
To understand how investor and first-time homebuyer competition shifts across geographies, Neighbors Bank analyzed market share in 10 cities with notable investor presence and compared it to mid-sized and small-sized cities within the same states.
Here’s a look at the percentage of starter homes bought by investors vs. first-time homebuyers in 30 varying-sized metros across the U.S:
What Is a Starter Home?
Traditionally, a “starter home” refers to a modest, affordable property purchased by a first-time homebuyer, typically smaller in size and lacking luxury features. Starter homes emerged in post-World War II America when government programs like the and made homeownership accessible to middle-class families, leading to the development of .
These smaller, simpler homes were designed to serve as entry points into homeownership, with the expectation that owners would eventually “trade up” to larger properties as their incomes and families grew.
In this study, the researchers defined a "starter home" as a home that a first-time homebuyer could reasonably afford. To determine this, they only included home purchases that were bought as primary dwellings and did not exceed 30% of the area's median household income. Housing costs included the mortgage principal, homeowners insurance, property taxes, and private mortgage insurance based on a down payment of 10%—a common amount for first-time homebuyers. Spending more than 30% of one's income on housing costs is a common benchmark used by to indicate a “housing burden.”
What Counts as an “Investor”?
The Home Mortgage Disclosure Act (HMDA) doesn’t explicitly define “investor” as a standalone purchase category. Instead, the data tracks the occupancy type that the property is classified as, along with other loan and property details.
For this study, the researchers identified investor activity by filtering for non-owner-occupied properties marked as “investor property” or "secondary purchase.” They also limited property values to align with what first-time homebuyers could realistically afford, to help filter out cases where small loan amounts were paired with large cash payments to purchase high-value properties.
It's important to note that the HMDA's “secondary purchase” category does not differentiate between buyers of vacation homes and those purchasing properties for rental income. Therefore, for the purposes of this study, the researchers defined an investor as anyone who purchased a home they did not intend to occupy as their primary residence.
5 Markets Favoring First-Time Homebuyers
Across the 30 metros analyzed, first-time homebuyers purchased an average of 69% of starter homes, compared to 31% purchased by investors. Notably, three of the five cities are high-cost markets, demonstrating that even in expensive areas, ownership-friendly policies can tilt the scales toward first-time homebuyers.
Here are five metros where first-time homebuyers outperform investors the most:
1. Denver, CO
First-time homebuyers accounted for an impressive 84.31% of starter-home purchases in the Denver, Colorado metro area, leaving investors with just 15.69%, a significant gap compared to the sample average.
This advantage stems partly from Denver’s , which prohibit non-owner-occupied properties as STRs, meaning only owner-occupied residents can list their homes. These rules limit investor profitability in popular neighborhoods, subtly favoring long-term residents and owner-occupants over speculative buyers.
2. Seattle, WA
In Seattle, first-time homebuyers claimed 81.16% of purchases, while investors represented 18.84%. The city’s make it difficult for investors to build large rental portfolios. Seattle allows each host a maximum of two STR units, and one must be their primary residence. When combined with Washington’s strong tenant protections and high acquisition costs, these measures reduce investor appeal and create more room for first-time homebuyers in an otherwise competitive market.
3. Los Angeles, CA
Approximately 80.75% of starter homes in Los Angeles went to first-time homebuyers, compared with 19.25% to investors—an impressive share, given the city’s high annual tourism.
State-level legislation and city ordinances work in tandem to support this balance. Under , tenants, nonprofits, and owner-occupants are given a 45-day window to match investor bids on foreclosed homes, thereby slowing the pace of bulk investor acquisitions. At the city level, Los Angeles’ Home-Sharing Ordinance restricts STRs to an owner’s primary residence, limits unhosted rental nights, and requires registration, reducing investor conversions of affordable housing into vacation rentals.
4. Indianapolis, IN
In Indianapolis, 78.22% of starter-home purchases were made by first-time homebuyers, compared with 21.78% by investors. While affordability across the Midwest plays a major role, local housing initiatives have also made a difference. Programs such as and the prioritize the sale and redevelopment of properties to owner-occupants, steering vacant and abandoned homes away from speculative investors. These measures help preserve affordable inventory and support neighborhood stability—conditions that favor first-time homebuyers.
5. Dayton, OH
First-time homebuyers accounted for 75.19% of starter-home purchases in Dayton, while investors represented 24.81%. The city’s balance is bolstered by programs through the Montgomery County Land Bank, including , which transfers properties with five-year deed restrictions requiring owner-occupancy. By keeping investor landlords out of these transactions, Dayton maintains a healthier supply of affordable homes available to entry-level buyers.
5 Markets Where Investors Hold an Edge
While most metros leaned toward first-time homebuyers, a handful stood out for their strong investor presence. Among the 30 cities Neighbors Bank analyzed, investors represented an average of 31% of starter-home purchases; however, in the metros listed below, investor activity far exceeded this average, ranging from roughly 42% to nearly 57% of all starter-home sales.
1. Miami, FL
Miami was the only market where investors outpaced first-time buyers, with investors purchasing 56.89% of starter homes compared to 43.11% by first-time homebuyers.
Florida’s state preemption law from banning STRs, allowing investors to freely convert properties without many restrictions. At the same time, the keeps rental profits fully market-driven. This flexibility, paired with Miami’s year-round tourism demand, has made the city a hotspot for both institutional and individual investors. Without local first-look programs or owner-occupant protections, Miami’s housing market remains tilted toward investor ownership.
2. Cleveland, OH
Investors captured 45.08% of starter-home purchases in Cleveland, leaving 54.92% to first-time homebuyers. While the city’s high investor share reflects the conditions at the time, according to 2024 HMDA data, new policies could shift that balance moving forward.
In February 2024, Cleveland passed the , a comprehensive housing package that requires non-owner-occupied properties to register with the city, obtain certificates of rental occupancy, and meet lead-safe standards. The initiative was implemented with the hope of forcing stricter accountability for out-of-town landlords and vacant property owners.
These measures weren’t yet in effect during the data period, but will likely help temper investor dominance in future years by making profit-driven home purchases more costly and favoring responsible, owner-occupancy.
3. Atlanta, GA
In Atlanta, investors accounted for 44.90% of all starter-home purchases, unsurprising given that Georgia’s housing environment leaves few barriers for investors. While STR hosts must register properties with the city, there are on the number of homes one can own or convert to rentals. Rapid job and population growth, paired with high rental demand, make Atlanta particularly attractive to investors seeking long-term appreciation and steady cash flow, factors that contribute to its elevated investor share.
4. Nashville, TN
Investors made up 44.33% of starter-home purchases in Nashville. A broader laissez-faire approach to STR regulation allows investors to continue purchasing properties across much of the metro. The limits how much local governments can restrict STRs and even grandfathers previously approved , preserving investor access in many neighborhoods. The city’s booming tourism industry and steady population inflow add to investor demand, driving competition higher for first-time homebuyers.
5. Oklahoma City, OK
Oklahoma City’s housing market remains relatively open to investors, who represented 41.89% of starter-home purchases. Oklahoma’s housing laws are among the most permissive in the country: The state prohibits and allows STRs to operate under a straightforward 17 rather than restrictive zoning or occupancy caps. These investor-friendly frameworks, coupled with the city’s low housing costs and strong rental yields, make Oklahoma City a consistent magnet for both institutional and small-scale investors.
What the Divide Reveals About the Future of Homeownership
Across the 30 cities analyzed, a consistent pattern emerged: First-time homebuyers continue to represent the majority of starter-home purchasers, though the balance between investors and owner-occupants varies widely by location.
The findings suggest that policy—not just price—plays a significant role in shaping access to affordable housing. Cities like Denver, Seattle, and Los Angeles show how measures such as primary-residence requirements and owner-occupant preference laws can help maintain a more balanced housing market.
In contrast, markets like Miami, Atlanta, and Oklahoma City illustrate how permissive investment environments can fuel investor demand. State-level rent-control preemptions and short-term rental protections keep these markets highly profitable for landlords and vacation-rental operators, often at the expense of first-time homebuyers.
Looking ahead, cities that have recently implemented new regulations (such as Cleveland’s Residents First legislation) may begin to see investor shares shrink as compliance costs rise and enforcement strengthens. Meanwhile, in states with little or no owner-occupant protections, investors will likely maintain a competitive edge.
Overall, the data points to a nuanced housing landscape: First-time homebuyers remain key participants in the starter-home market, but local rules and affordability policies continue to determine how accessible that market truly is.
Data Methodology & Definitions
This Neighbors Bank case study used the following assumptions and definitions:
- Assumptions: Every piece of data pulled for this study was from 2024 (which was the most recently available data in many cases), except for the property tax amounts, which were from 2023. The researchers assumed a 30-year mortgage at 6.72% interest rate (this was the average of the national weekly average interest rates in 2024) and a 10% down payment when calculating monthly mortgage payments. At this down payment amount, there is an assumption of PMI, which was included as 0.75% of the loan amount at the time of purchase.
- Starter Home Qualification: To determine how much a buyer can afford, Neighbors Bank calculated 30% of the average gross monthly income to set the affordability threshold. Then, with the aforementioned assumptions, the researchers summed the possible monthly costs of the mortgage, including average HOI costs by state, tax rate by county, and 0.75% annual PMI payment. By utilizing these variables, they could determine how much house a buyer can afford without exceeding the 30% affordability threshold when accounting for these recurring homeownership costs. They did not include monthly utility costs as a factor in determining home affordability.
- Investor Assumption: A purchase was deemed an investor purchase if the occupancy type was marked as “secondary residence” or “investment property”. Additionally, Neighbors Bank used the starter home qualification amount as a cap for property value to limit cases where investors combined loans with large cash amounts.
- First-Time Homebuyer Assumption: A purchase was deemed a “first-time homebuyer” purchase if the HMDA occupancy type was marked as “primary residence” and the sum of the 10% down payment and loan amount was determined as affordable using the 30% affordability threshold.
- HMDA Data: Since many HMDA variable thresholds are every $10,000, rounding was executed to the nearest $10,000 based on the specific value. For example, if the median income of an MSA was $64,320, the researchers would include all filters up to $50,000-$60,000; if the median income was $66,320, the research team would include all filters up to $60,000-$70,000. This is concurrent with the property value, loan amount, and down payment amount variables. For all pulls, three filters were included by default. All data is based on originations from 2024 where the loan purpose equaled “purchase.”
This Neighbors Bank analysis draws on data from the Consumer Financial Protection Bureau’s HMDA 2023-2024 lending dataset, the Tax Foundation, homeowners insurance cost estimates from NerdWallet, and household income and affordability benchmarks from the U.S. Census Bureau and the Federal Reserve Economic Data (FRED).
was produced by and reviewed and distributed by şÚÁĎÉç.


